Step by step guide
This guide describes the setup of a Eclipse / LPC8xx HW debugging environment in Windows.
ARM chips like the STM32 and the LPC8xx series as used in the PicosARM and jeelabs.org projects provide hardware debug facilities. For instance, the LPC810 has some pins providing On-Chip Debugging (OCD). Two of those pins provide the Serial Wire Debug interface, the SWD. There is a slight drawback. To use this it requires an additional hardware adapter to interface between a USB-port of your computer and the ARM-chip. Several JTAG debuggers are around. ARM-chip makers usually provide demo-boards and some of them implement a variant of a JTAG/SWD debugger.
LPC-Link
NXP provides LPCXpresso boards. Around EUR 16 for a LPC812 board. From reading the LPC forum and further searching the internet I get the impression that Eclipse/OpenOCD support is substandard. and that it might only properly work with NXP’s own version of the Eclipse IDE: LPCXPresso.
STLink / ST Discovery / ST Nucleo boards
ST provides very inexpensive demo boards. Just above EUR 10. Currently the Nucleo STM32 boards. Those boards have the STLink-V2-1 SWD interface that can be used for external SWD programmable devices as well. Linux and OpenOCD support is good. Despite being designed by the supplier of the STM32 chips, it also works with NCP LPC chips! The STLink-V2-1 part of the Nucleo board is what I use in the following text.
Basic steps for setup
- Install OpenOCD
- Configure OpenOCD for the Nucleo/LPC8xx combination
- Install STLink-V2-1 USB drivers
- Create OpenOCD External Tool in Eclipse CDT
- Create Debug configuration with GNU debugger in Eclipse CDT
- Connect the target to the STLink device
- Build a project and start stepping through the code.
Install OpenOCD
OpenOCD is a server that connects to the target (the LPC8xx to be debugged or programmed) and that handles debugger commands. The current release is version 0.8.0. Download a executable (binary) version from Freddie Chopin’s site.
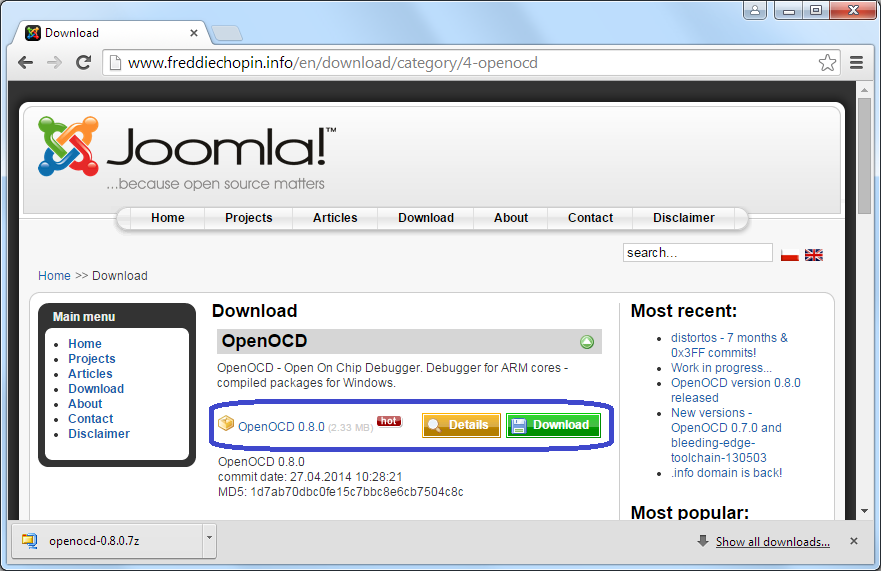
In File explorer, create or go to the PicosARM root folder. When you followed this PicosARM guide, it is located in C:\PicosARM. Unzip the openOCD download in the tools folder. A folder containing OpenOCD will be created in tools: C:\PicosARM\openOCD0.8.0.
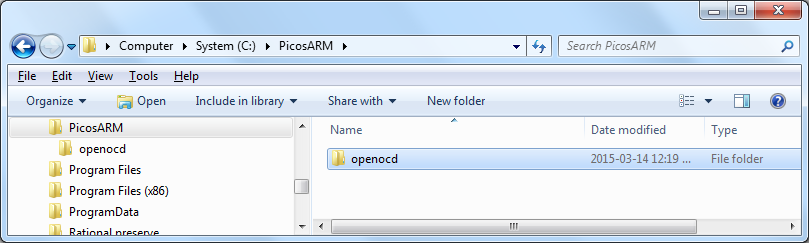
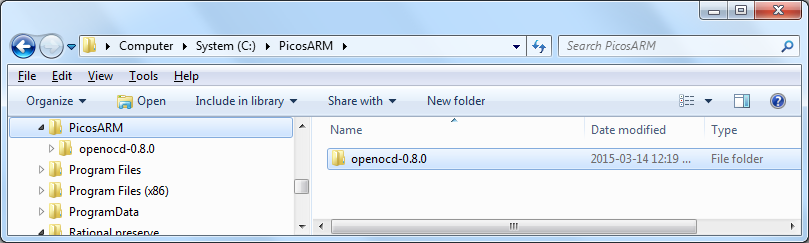 To avoid some future maintenance, rename this folder to
 openOCD, without the version number in it.
Note: Winzip may refuse to unpack. In this case download and use 7-zip to unzip
Configure OpenOCD
OpenOCD requires some additional configuration for the specific hardware we are using as HW debugger (Nucleo STM32) and Micrcontroller target (LPC8xx). OpenOCD 0.9.0 is providing more extensive support for the LPC8xx series. It requires a slightly different configuration then OpenOCD 0.8.0. Here we proceed with the OpenOCD 0.8.0 configuration, but 0.9.0 cfg files are also available for download.
Download the Nucleo/LPC8xx cfg files from the PicosARM github repository. For OpenOCD-0.8.0, this is the LPC8xx-Nucleo link.
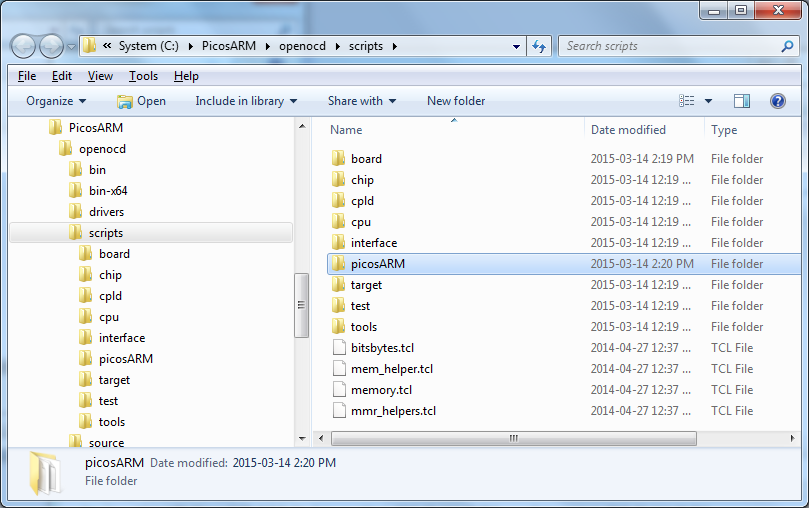
In the just installed OpenOCD, browse to the openocd/scripts folder and unzip the .cfg files to this location.
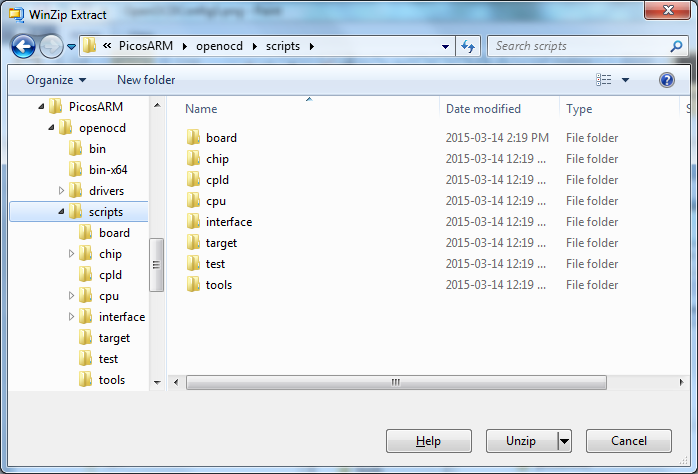
Make sure that within the script folder an picosARM folder is created:
Install STLink-V2-1 USB drivers
This step is specific for the exact JTAG/SWD debugger that will be used. In this guide it is the STLink-V2-1 interface of a Nucleo STM32 board. It does not matter which of the Nucleo boards is used. All are equipped with the same STLink device. If you already have connected a Nucleo to your PC before, then you probably already performed this step.
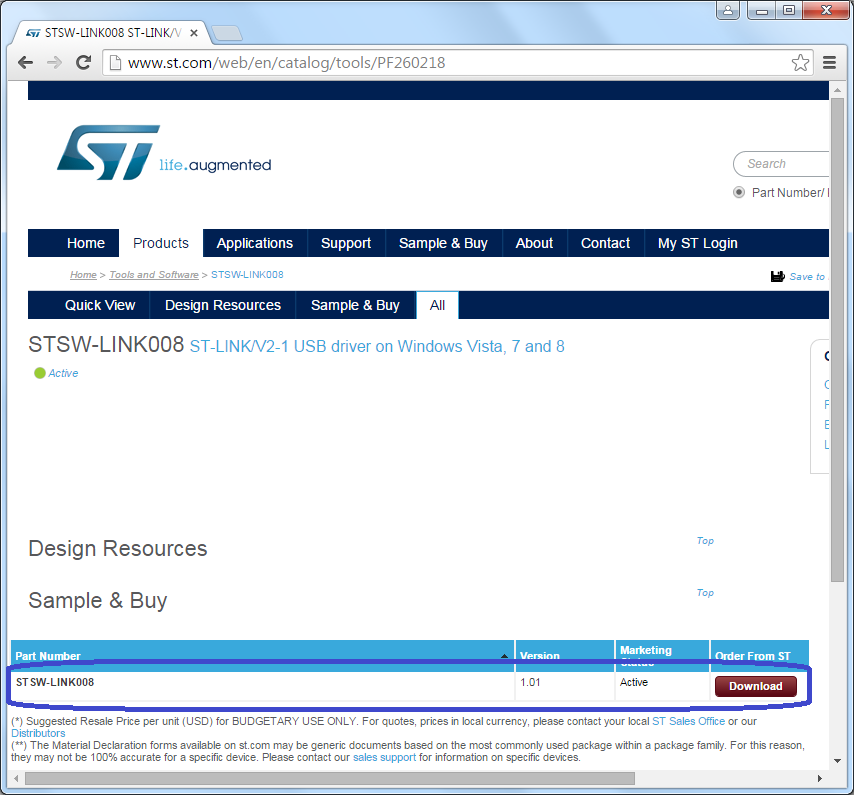
Download the drivers form the ST-website.
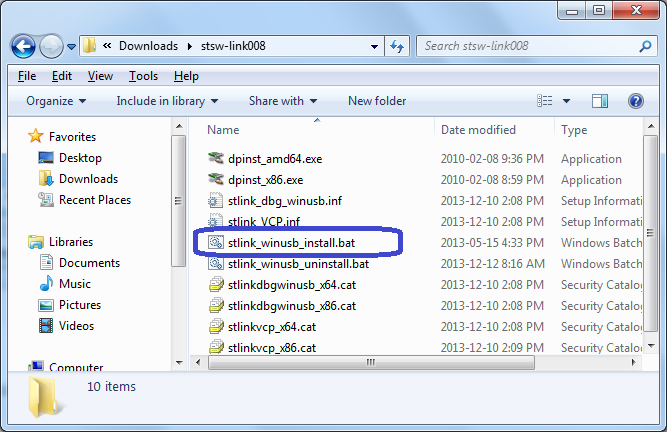
Unzip the downloaded file and run stlink_winusb_install.bat to install the USB drivers
Now connect the Nucleo to your computer and see whether windows properly recognizes the Nucleo board.
Create Eclipse CDT External Tool
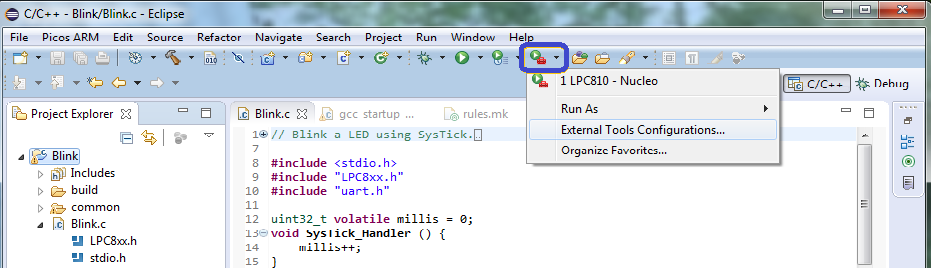
Start Eclipse and go to the HelloLPC or Blink project. This guide uses a Blink project as example. The second row of the screen is the toolbar. Just below the main menu. On this menu is the External Programs tool, which we can use to launch OpenOCD. To setup OpenOCD as External Program open the External Tool Configuration screen:
The editor is opened. Press the Create new button and fill the fileds in the main tab.
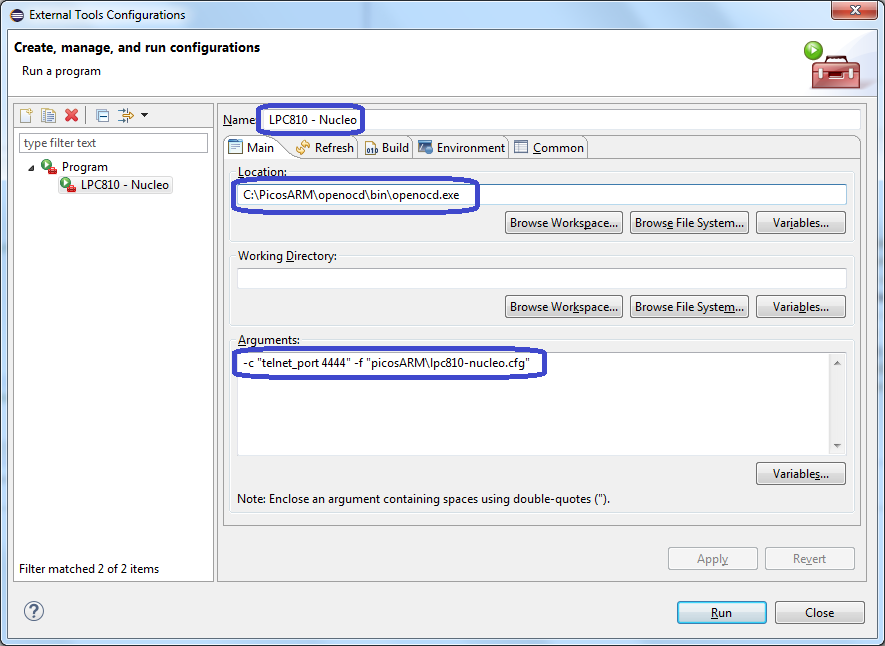
Set field Name to LPC810 - Nucleo
Set field Location to C:\PicosARM\openocd\bin\openocd.exe
Set filed Argumets to -c "telnet_port 4444" -f "picosARM\lpc810-nucleo.cfg"
All other settings can remain unchanged.
On the “Common” Tab, check the “Exteral Tools” as display favorite:
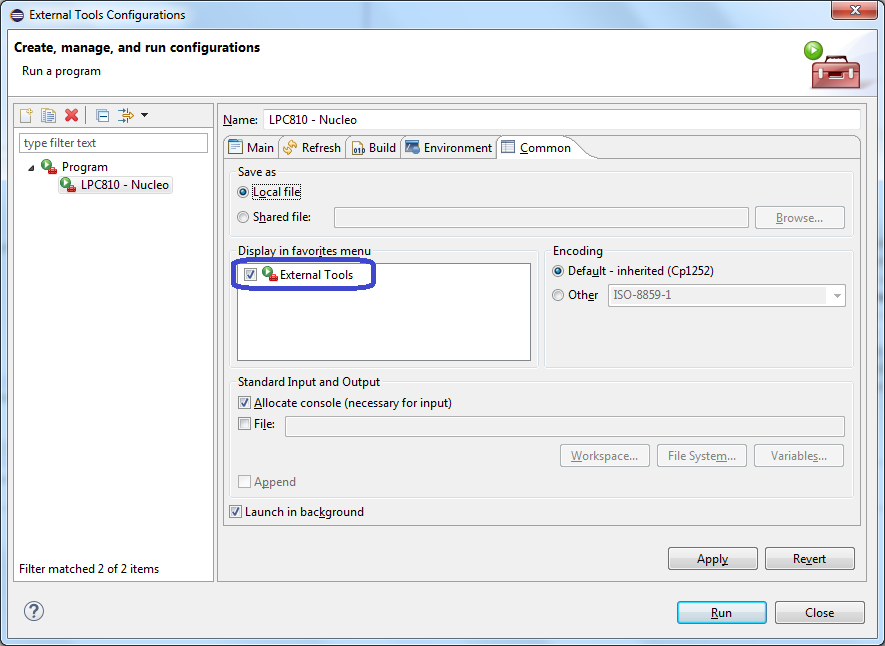
The External tool is configured now.
This example uses a LPC810. For other LPC8xx boards, just replace all LPC810 by the proper LPC number on the “Main” Tab, for example to LPC824.
Create Debug configuration in Eclipse
Make sure the project is already build. The following step requires a firmware image to be available. Open the Debug Configuration Editor through the toolbar:
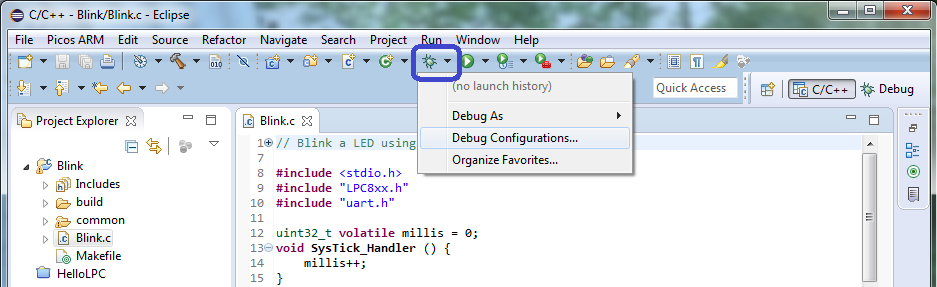
Select “Debug Configurations…”
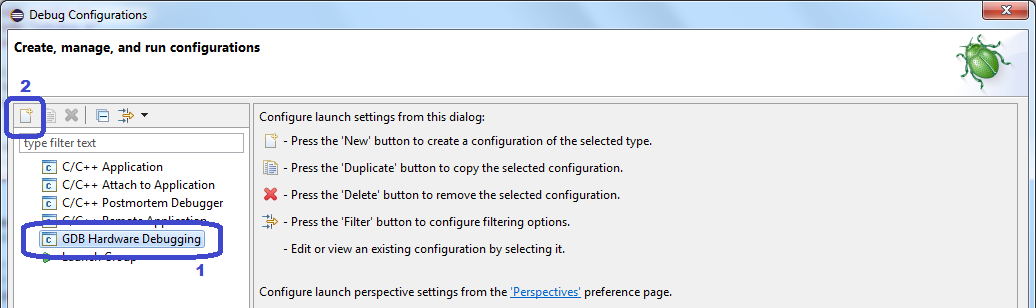
On this screen Select “GDB Hardware Debugging” and press the “New” button:
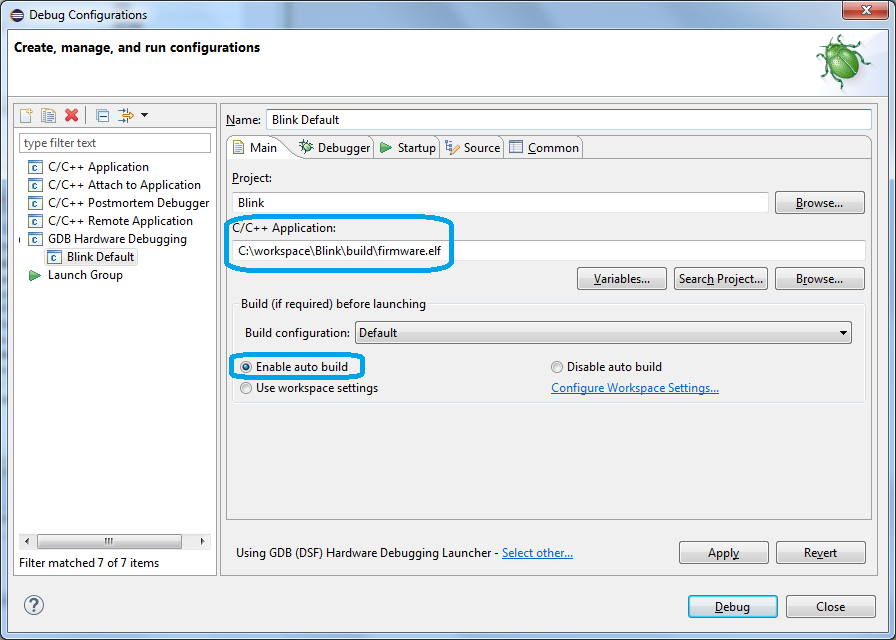
On the “Main” Tab enter:
C/C++ Application: C:\workspace\Blink\build\firmware.elfSelect “Enable auto build”
Leave all other fields unchanged.
Go to the Tab “Debugger”:
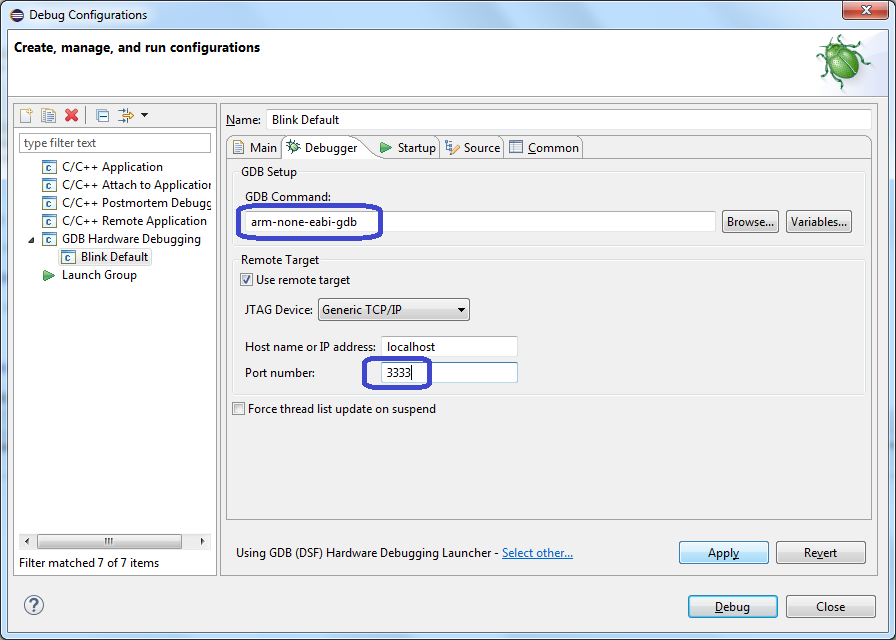
Enter the following, and leave other fields unchanged:
GDB Command: arm-none-eabi-gdb
Port Number: 3333
Go to the “Startup” Tab:
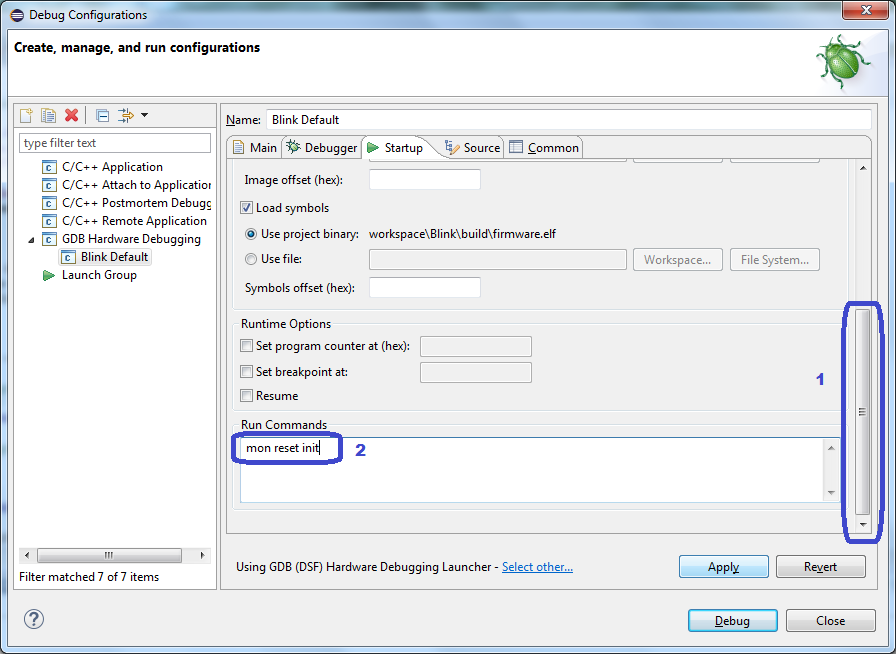
Make sure to scroll to the bottom of the entry form: Enter:
Run Commands: mon reset init
Go to the “Common” Tab
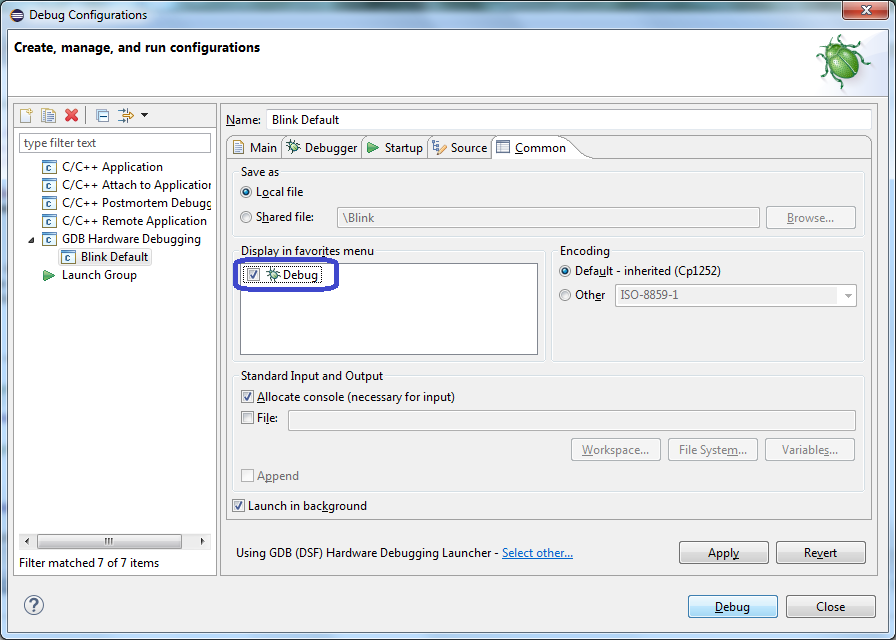
Check “Debug” as display favorite, and press “Apply”, press “Close” to exit the editor. Eclipse is now prepared for debugging!
Connect the target LPC8xx
Plugin the USB cable of the Nucleo STLinkV2-1 interface into the computer. How to connect the LPC8xx to the Nucleo boards SWD interface is described in article LPC810 SWD / JTAG with Nucleo STM32
Download firmware and start flashing.
The following describes typical steps in a build/download/debug session. Build the project by pressing the hammer-tool (Build).
Start the External Program “LPC810 – Nucleo”:
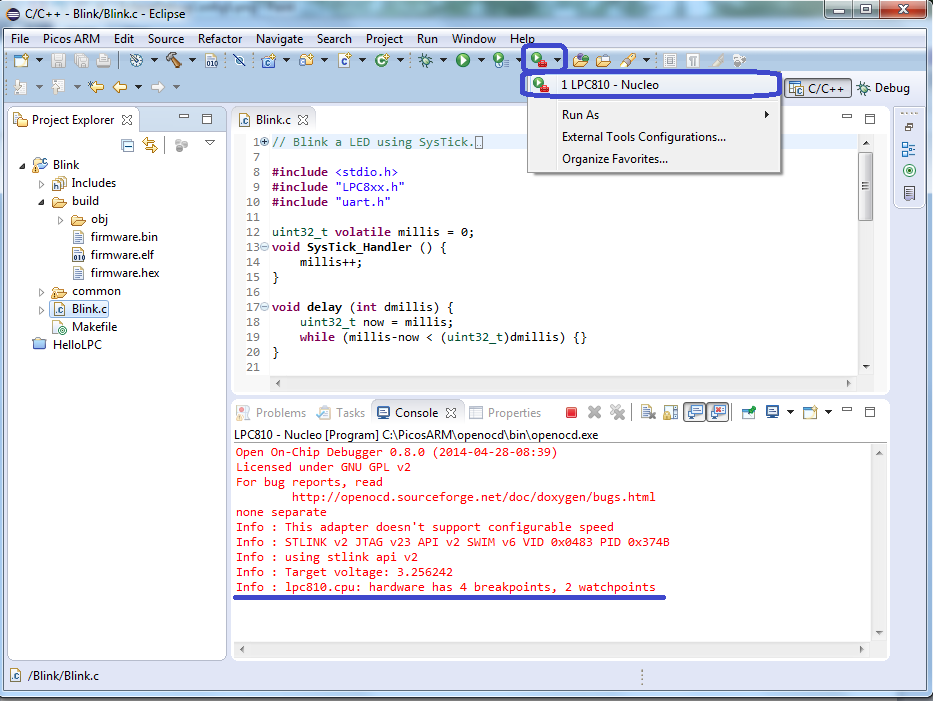
When the HW (both Nucleo and LPC810) is connected correctly, the concole panel will report the STLink interface and the LPC810 target. When the last line reads Info: lpc810.cpu: hardware has 4 breakpoints, 2 watchpoints, everything is OK.
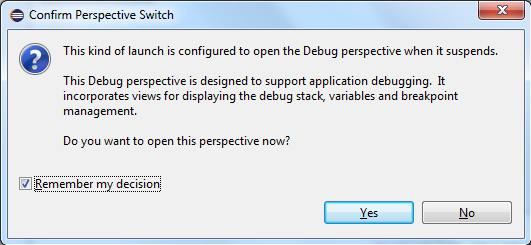
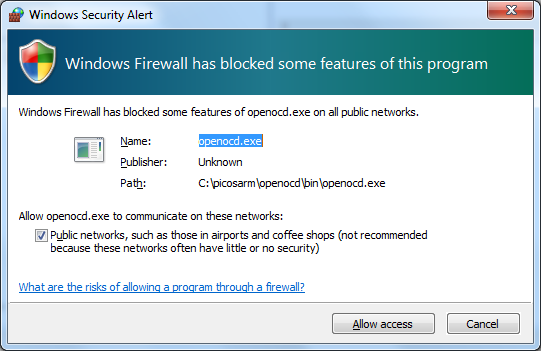
When activating the External Program, two things may happen. Eclipse may suggest to switch to a debug perspective, and the Windows Firewall may ask for permision for OpenOCD using a port. Confirm (Yes/Allow Access) these situations:
Then download/flash and run the application in Debug mode, through the toolbar:
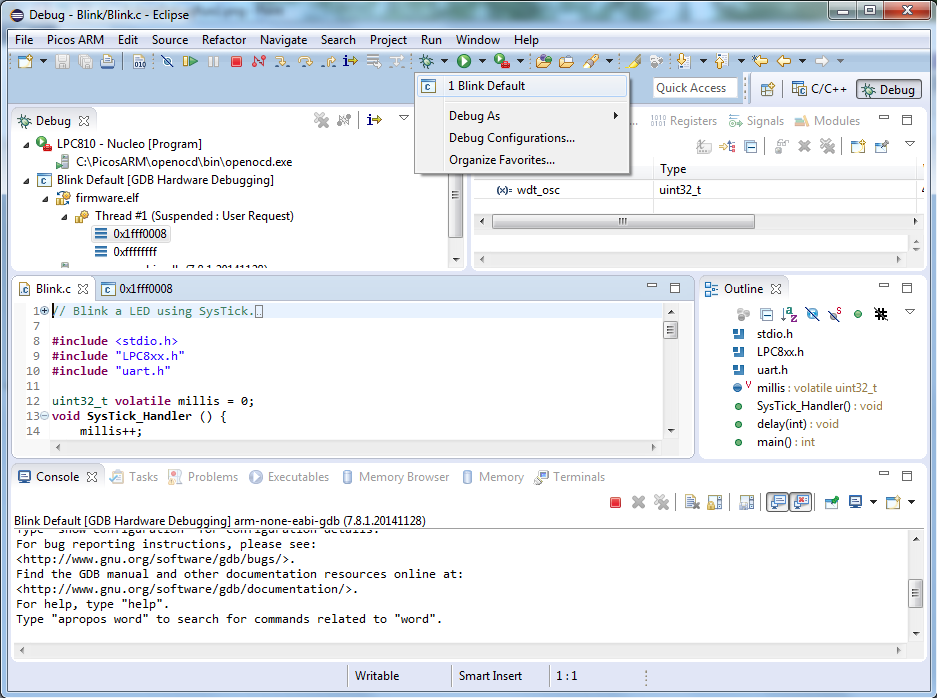
Select “Blink Default”. This rebuilds the project if needed, downloads it to the target LPC, and automatically breaks at the first instruction of the program:
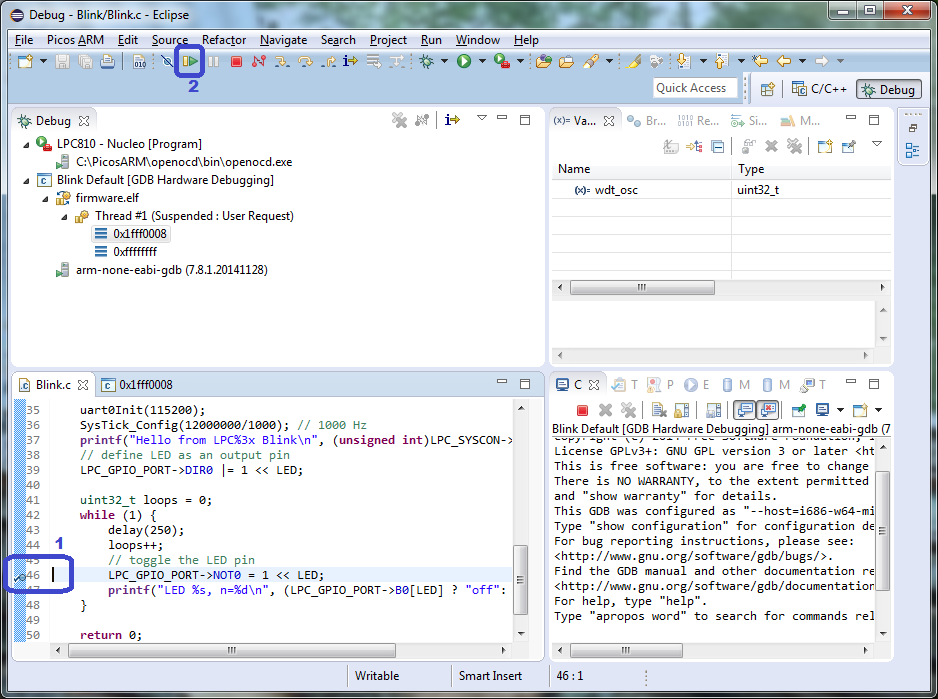
Before pressing the the run/play button, for demonstration purposes set a breakpoint in the main program source code Blink.c, at the instruction that toggles the LED, line 46. To set the breakpoint double click the line number. Now press “Play”. After a moment, the program stops at the breakpoint:
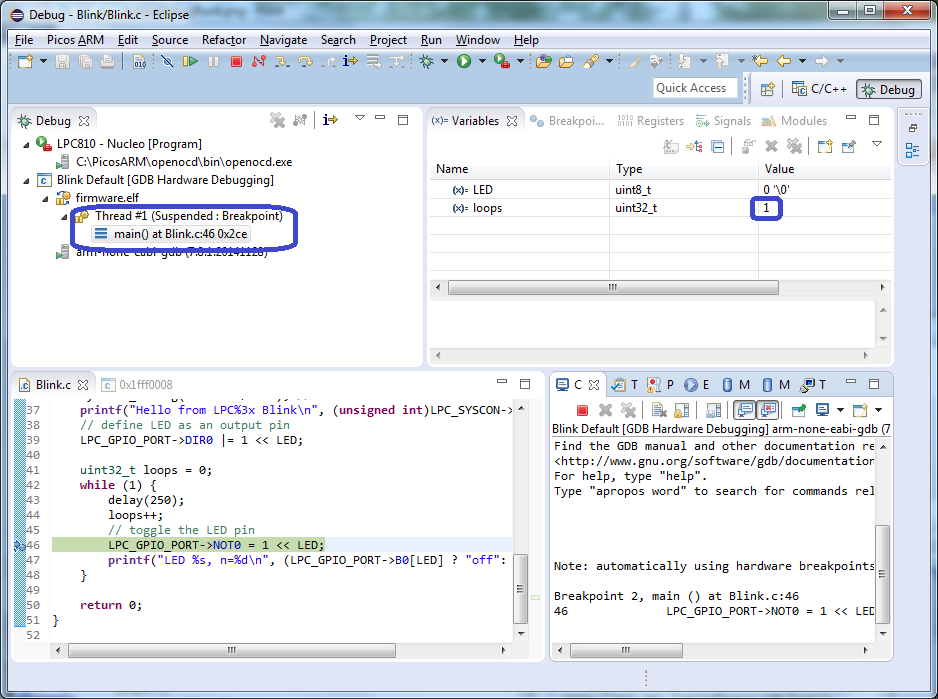
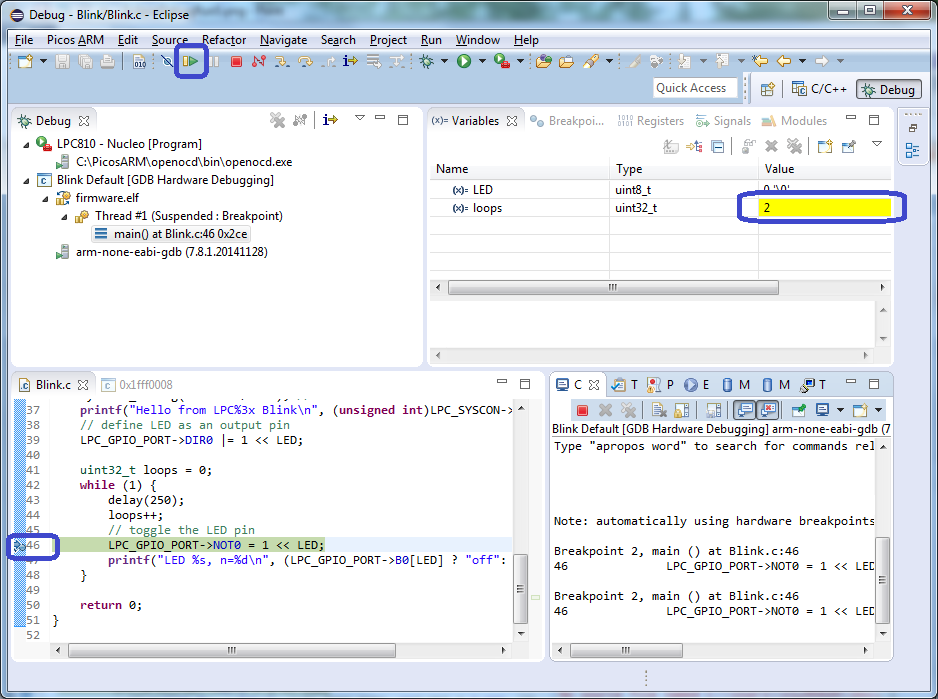
It can now be seen that the program is suspended, and that the loop counter is set to “1” in the Variables panel. Press “Play” again. The program breaks again, and the loop counter is now updated to “2”:
Now double click the breakpoint at line 46 again to remove it, and press “Play”. Now the program starts running uninterrupted. The LED should be blinking. Now press the pause button, and there is a good change the program breaks at the waiting loop in the delay() function:
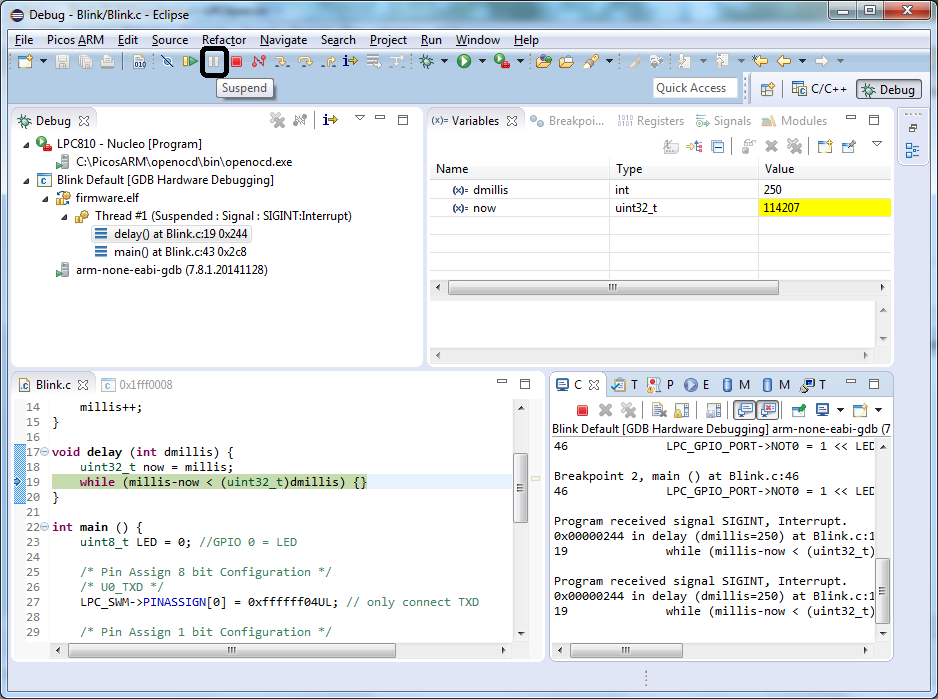
This form of debugging the code by actually tracing the execution is a very valuable tool for embedded applications. With this and the previous guide, Eclipse is configured for developement of LPC8xx applications.
Due to a coding error in OpenOCD there is a chance that the download fails with an error code 9 in the console of the External Tool. This is related to the size of the firmware to be flashed. A workaround is to increase the flash image by about 256 bytes. An example will be added in a separate post.
Thanks for this excellent tutorial!!
I’m a dedicated fan of the JCW blogs and was looking for a full IDE/debug environment on a Windows machine.
Your blog is a great help to achieve this.
I’m just experiencing 1 problem in the 3rd step: HW debugger, para. Create Debug configuration in Eclipse.
In the screen ‘Debug Configurations’ the choice “GDB Hardware Debugging” doesn’t show up.
Any ideas?
Doewie
Hi Doewie,
Sorry for this late reply. I already replied, but under the wrong eclipse post. By now I have figured it all out. I will update this post soon. The problem is that the latest eclipse version changed from LUNA to MARS. Apparently, MARS does not include GDB by default. A manual installation for GDB is required:
Menu Help -> Install New software…
in box “work with” select Mars – http://download.eclipse.org/releases/mars
Wait for the list to update
Expand Mobile and Device Development
Select GDB HW Debugger
Press Next, press Next again, accept the license and press Finish.
After the software installation is finished, Eclipse proposes to restart before the plug-in gets activated. Press Yes to restart.
This should do the trick.
Please let me know whether it works now.